Day Trading Lessons: 9/18/23 - 9/22/23
Read Time: 4 Minutes
This past week has been a huge learning week for me. I've been studying historical $SPY charts in an effort to become a master at reading price action and I've started to compile my trade data so that I can see which trade setups I should eliminate and which ones I should double down on.
Learning Lessons from Studying Price Action:
I've been trying to get better at reading price action so I've been spending time studying historical $SPY charts. Here are a couple of my big takeaways:
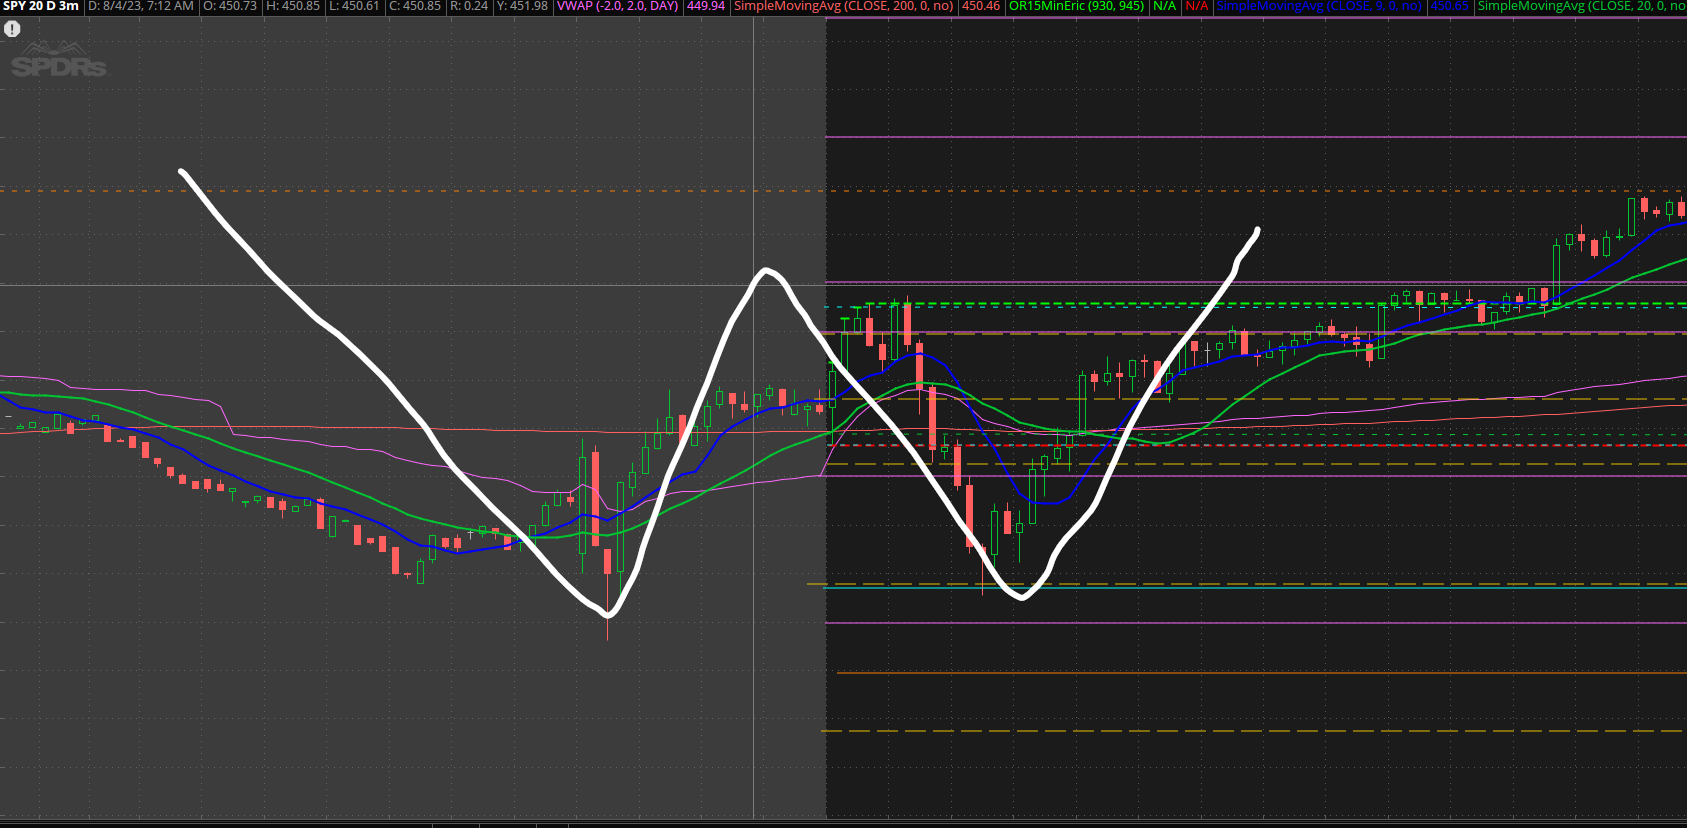
Pre-market price action offers more clues than I realized:
Specifically, I noticed that the final 2-3 hours of pre-market price action can provide hints about which direction $SPY will move during the first 1-2 hours of the trading day. I also noticed that $SPY regularly forms double bottom and double top chart patterns during the first hour - where the second bottom or top lines up perfectly with the last swing high or swing low on the pre-market chart. Here's an example:
Reading price action is harder on bearish days (at least for me):
I don't know why that is but I always seem to be fighting the trend on down days. I mentioned this to my trading mentor and he suggested that I pull up the inverse $SPY chart (instead of entering "SPY" into my charting tool, I entered "-SPY"). Doing this flipped the chart so that price moves up and to the right on down days and down and to the right on up days. It still seems odd, but having the inverse chart pulled up on my second monitor has helped me identify downtrends more quickly; allowing me to trade with the trend instead of against it. If you have a hard time seeing bearish price action, I'd recommend testing out this strategy.
Learning Lessons from Analyzing My Trade Data
I've always done a good job of reviewing/analyzing my trades but I haven't been documenting my trade data in a spreadsheet. That was a big mistake because right now, I'm about 15 hours into compiling my trade data so that I can begin to look for trends. I'm still working on this, but here are a few tips/takeaways so far:
The more details you include the better:
At a minimum, I'd recommend that you include the following data for each trade: Date, Time, Result (Win or Loss), Trade Setup, Risk ($), and Trade P&L. This will allow you to see which of your trade setups perform the best and which ones perform the worst.
See if you perform better during certain times of the day:
I would also suggest adding a "Timeframe" column that puts your trades into 15-minute increments. For example, a trade placed at 9:49 would be tagged as a 9:45 trade and a trade placed at 9:56 would be tagged as an 10:00 trade. This will tell you which parts of the day you trade the best. You can also use this information to see if certain trade setups perform better or worse at different times of the day.
When it comes to trading, less is more:
I haven't done a ton of analysis yet because I'm still working on compiling my trade data, but one thing is already abundantly clear: A very small number of my trade setups have accounted for the majority of my trading wins. And everything outside of those 2-3 setups has accounted for the majority of my trading losses. It appears to be a perfect example of the 80/20 principle. Moving forward, I will be doubling down on the 20% of my setups that account for 80% of my profits... and I will try to eliminate the 80% of my setups that account for just 20% of my profits.
That's it for this week's newsletter. I hope you've learned something that will make you a better trader and I hope you have a great week ahead!
- Eric
Join the Day Trading Inner Circle
Follow along as I strive to become a profitable day trader. Every Sunday, I send out an email with my weekly trading stats plus the most important learning resources that I discovered that week. Drop your email in the box below to join the inner circle.
Home Newsletter Signup
Previous Issues of Side Hustle Steroids