Day Trading Stats & Lessons: 7/24/23 - 7/28/23
Read Time: 4 Minutes
It was a short trading week for me after wrapping up my family vacation on Wednesday, but I took advantage of the remaining two days and logged my first profitable week since the middle of May. Here's a breakdown of my stats and learning lessons:
Weekly Trading Stats:
Total Trades: 6
Winning Trades: 3
Losing Trades: 3
Win Rate: 50%
Weekly P&L: $102.64
Weekly ROI: 2.17%
Beginning Balance: $4,735.24
Ending Balance: $4,837.88
Weekly Trading Recap:
Thursday was the first day that I've traded since taking a 10-day break while on vacation with my family. After the long break, I made it a point to trade lightly until I felt dialed in. Unfortunately, this caused me to miss a couple of great trade opportunities early in the day. I finally ended up taking a trade at 11 a.m. EST but it came up a few cents short of my first profit target before ultimately getting stopped out for a $50 loss.
The good news is that I turned things around on Friday, logging 3 winning trades that brought me into profitability for the week. The winning trades earned $180, $80, and $78 (minus commissions).
My Best Trade:
Profit: $180
Entry Date & Time: Friday, 7/28/23 at 12:27 PM EST
Option: $SPY | $457 PUTS | 0DTE
Contracts: 6
Entry: $0.43
Stop Loss: $0.38
Profit Target #1: $0.58 (3X my risk)
Profit Target #2: $0.68 (5X my risk)
Profit Target #3: $0.93 (10X my risk)
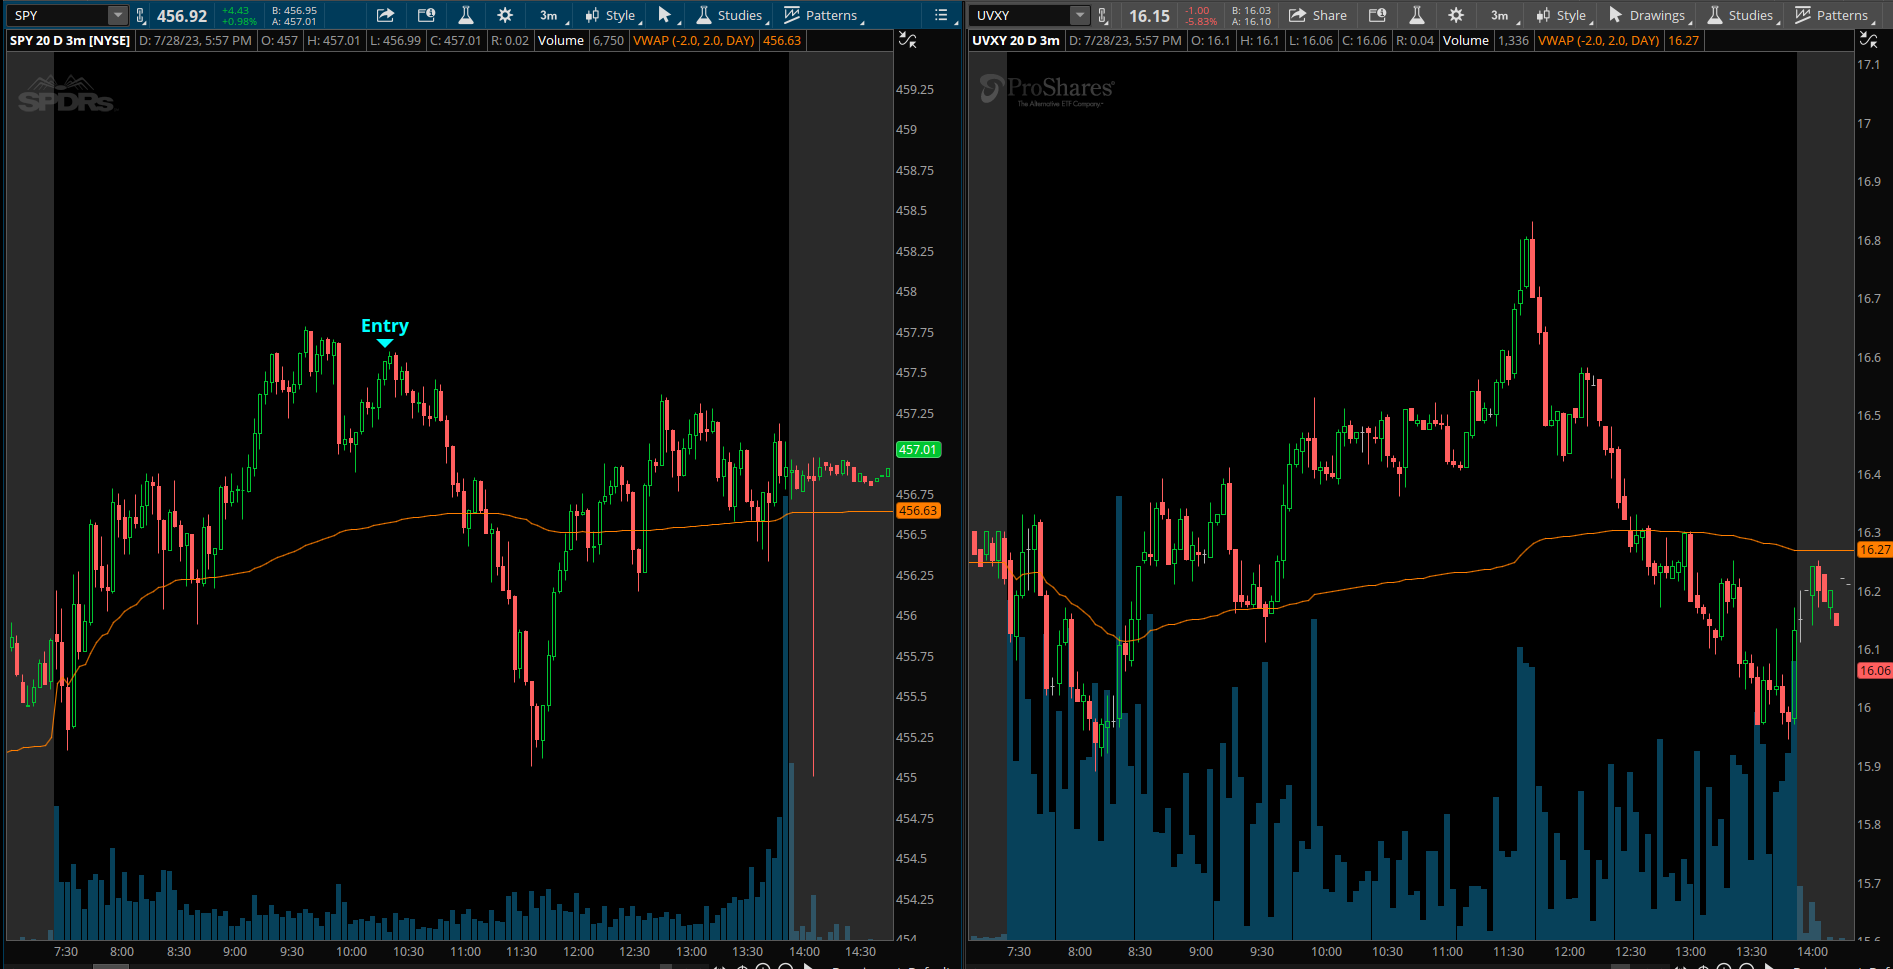
Result: This trade was considered a rule break because it was outside my 9:30 - 11:30 trading window but it was too good of a setup to pass on. As you can see from the image below, I entered my short position right at the top and then watched as $SPY dumped over the next hour. The reason I liked the setup was because price was coming up on the intraday high but it felt like momentum was slowing. Then, I looked at the $UVXY chart (which shows intraday volatility) and noticed that it was trending up and looking to break out. This told me that a big move could be coming; and typically when $UVXY goes up, $SPY goes down. So I entered PUTS with a stop loss of $0.38 - which was a level that had been holding all day. The trade worked out to perfection, hitting all three of my profit targets for a big win.
My Worst Trade:
Profit: -$102.00
Entry Date & Time: Friday, 7/28/23 at 09:48 AM EST
Option: $SPY | $456 PUTS | 0DTE
Contracts: 6
Entry: $0.46
Stop Loss: $0.36 initially then moved to $0.29
Profit Target #1: $0.76 (3X my risk)
Profit Target #2: $0.96 (5X my risk)
Profit Target #3: $1.46 (10X my risk)
Result: Going into the day, I marked the area between $456.90 and $457.40 as a place that I'd like to go short. Within that range was a key support/resistance level on the 1D chart and the top of an upward channel that has held extremely strong since early May. Based on that, I thought a reversal in that area would be likely. The problem is, I jumped the gun way too early and entered the trade as soon as price sniffed the lower end of the range that I was targeting. This forced me to set a wide stop loss and then extend that stop loss even further as price moved toward the end of my range. Before I knew it, I had a 17-cent stop loss with more than 2% risk. In the end, I got stopped out shortly before price made the move that I expected.
Takeaways:
1) If I have a range where I want to enter, I should enter the trade in phases. Enter 1/3 of my position when it hits the range, 1/3 when it gets to the middle, and 1/3 when it gets to the top of the range.
2) I need to remember that trend lines and high time frame support/resistance levels are not exact. They give a good idea of the general area where price might reverse, but I can't blindly enter at those levels. Price action must confirm the move before I enter a trade.
Learning Lesson of the Week:
This week, I started watching how the $SPY (S&P 500), $QQQ (Nasdaq), $IWM (Russell 2000), and $UVXY (intraday volatility) charts move together and it made a huge difference for me on Friday. As it turns out, watching these four charts can be a great way to identify moves before they happen.
$SPY, $QQQ, and $IWM typically move together and $UVXY usually moves in the opposite direction. So if you notice that $QQQ and $IWM are suddenly dropping, $IWM is moving up, and $SPY is holding strong, you would want to look for opportunities to short $SPY.
I'm still getting a feel for things, but I would recommend putting those four charts next to each other and watching how they move in relation to each other. I'd also recommend throwing VWAP on each chart for added insights.
Here's a quick video explaining how I used these charts on one of my profitable trades yesterday:
Trading Goals for Next Week:
1) 6.5% ROI for the week
2) 50% win rate
3) No taking low-quality trades after winning trades
That's it for this week. I hope you've learned something that will improve your trading.
See ya next week!
- Eric
Join the Day Trading Inner Circle
Follow along as I strive to become a profitable day trader. Every Sunday, I send out an email with my weekly trading stats plus the most important learning resources that I discovered that week. Drop your email in the box below to join the inner circle.
Home Newsletter Signup
Previous Issues of Side Hustle Steroids